It is 6:40 on the second Tuesday of the month, and the operations director for a six-hospital group is sitting in front of four browser tabs and a spreadsheet she has rebuilt eleven times. Two of the hospitals run Cornerstone on local servers. Three run ezyVet. The sixth, acquired in March, is still on AVImark and will be for another two quarters. She needs one number for the Thursday board call: average client transaction, by location, trailing three months, compared to the same period last year. The Cornerstone sites export a report that counts declined estimates differently than the ezyVet sites do. The AVImark site has three item codes for the same canine rabies vaccine because two former practice managers each added their own. By 8:15 she has a number. She does not fully trust it, and neither does anyone on the call. This is the daily reality that multi-location veterinary analytics is supposed to solve, and the reason so many groups end up buying something twice before they get it right.
That scene is not a technology failure so much as a structural one. Practice information management systems were designed to run a hospital, not a portfolio. They hold the schedule, the record, the invoice, and the inventory for one building, and they do that job reasonably well. What they were never architected to do is answer portfolio questions: which of my locations is leaking revenue, which doctor cohort is underproducing relative to their schedule, where is inventory sitting dead, and which hospital's client retention is quietly sliding. Those questions require data from multiple systems, normalized to a common language, refreshed on a predictable cadence, and presented to people who are not analysts.
The market has responded to this in three fairly distinct ways, and understanding the differences between them is most of the buying decision. Groups that skip that step tend to buy a dashboard when they needed a data warehouse, or build a data warehouse when a dashboard would have been sufficient for another three years. Both mistakes are expensive, and the second one is expensive in headcount rather than software fees, which makes it harder to unwind.
There is also a timing dimension. Consolidation has pushed more practices into multi-site ownership structures, and capital partners increasingly expect monthly reporting that looks like healthcare services reporting rather than veterinary practice reporting. A two-hospital owner-operator and a forty-hospital platform backed by private equity are technically shopping in the same category, but they are solving different problems with very different budgets. This guide tries to serve both, because the underlying data problems are identical even when the solutions are not.
This article is published by VetSoftwareHub, an independent vendor-neutral directory with no financial relationship with any of the companies covered here. We do not accept referral fees or equity positions, and we do not steer practices toward any particular product. What follows is a plain-language overview of the landscape.
Why multi-location veterinary analytics is harder than it looks

Every group that starts this project underestimates it. The demo looks clean, the sample dashboards are beautiful, and then real data arrives. Four structural problems account for most of the pain.
The same service has six different names
This is the one that eats projects alive. A canine rabies vaccine might be coded RAB1, RABIES-1YR, VAC-RAB, or simply "Rabies" depending on which practice manager set up the item file and in what year. Multiply that across roughly 2,000 to 6,000 active item codes per hospital, then multiply again across locations, and you have a mapping problem that no dashboard solves by itself. Somebody has to decide that these fourteen codes across six hospitals all mean the same thing, and somebody has to maintain that decision as new codes get added every month.
This is what the industry calls normalization, and it is the single largest differentiator between analytics products. Vetsource, whose data business grew out of the VetSuccess acquisition, has built much of its group offering around exactly this problem, mapping revenue transactions into consistent categories regardless of what any individual practice calls the item. Whether a vendor does this work for you, hands you a mapping tool, or quietly assumes you will do it yourself is a question worth asking in the first thirty minutes of any demo.
Your PIMS was built to run one hospital
Even the enterprise-oriented cloud systems carry architectural assumptions from their single-site origins. Some store each location in a separate database instance, which makes cross-site queries a synchronization exercise rather than a query. Some support a single item file across all locations, which is wonderful for consistency and painful during acquisitions when the new hospital's pricing does not match. Some allow per-location price lists but report on them inconsistently.
ezyVet acknowledges this directly in its own documentation, noting that its standard reports and API work well until an organization needs data across more than one site or has data volumes those methods were not designed for, which is the reasoning behind its separate Data Lake offering for enterprise customers. Provet Cloud tiers reporting similarly, with data exports and a data warehouse option positioned at the enterprise level rather than the core plan. Vetspire's analytics allow filtering the KPI dashboard across multiple locations natively, which is a genuine advantage for groups standardized on it. The pattern across all of them is the same: multi-site reporting is a distinct capability, usually gated, and rarely included in the base price. If you are still deciding on your underlying system, our cloud PIMS guide covers how these architectural choices show up in day-to-day operations.
API maturity varies enormously, and so does vendor cooperation
A third-party analytics platform can only be as good as its access to your data. That access ranges from a modern documented REST API to a nightly file drop to a vendor that will not permit third-party extraction at all without a partnership agreement and a per-hospital fee. Some vendors charge a setup fee plus a recurring per-location integration charge, which at thirty hospitals turns a modest analytics subscription into a meaningful line item.
The honest answer is that API access in this industry is a commercial decision dressed up as a technical one. Before you sign with any analytics vendor, confirm in writing that your PIMS vendor will permit the connection, on what terms, and at what cost. Groups discover this in the wrong order more often than you would expect.
The denominator problem
Even with clean data, groups disagree with themselves about definitions. Is an active client someone seen in the last twelve months, eighteen, or twenty-four? Does a full-time-equivalent doctor mean forty hours, thirty-six, or scheduled appointment hours? Does average client transaction include or exclude retail food, dispensing fees, and declined items? Do you count a recheck as a visit?
None of these has a correct answer, but a group with six locations and no written definitions will produce six different versions of the same metric. The tool cannot fix that. It will simply automate whichever inconsistency you feed it, faster and with better typography.
The strategic value to practices

Set against those difficulties, the case for building real reporting infrastructure is straightforward, and it shows up in three places.
Operationally, the value is variance detection. When you can see the same metric across locations on the same definition, outliers become obvious rather than anecdotal. Schedule utilization running at 62 percent at one hospital while three others sit above 80 percent is a staffing and marketing conversation you cannot have without the comparison. The same holds for appointment lead times, no-show rates, and the ratio of technician appointments to doctor appointments, which is one of the more reliable early indicators of whether a hospital is actually leveraging its support staff.
Financially, the value concentrates in price integrity and charge capture. Groups routinely find that the same procedure is priced differently across locations for no strategic reason, usually because a price increase was rolled out at four hospitals and missed at two. Missed charges follow a similar pattern, clustering by doctor and by service type in ways that are invisible at a single site but glaring across a portfolio. Inventory is the third pocket, and it is often the largest: shrink, expired product, and overstocking are location-specific problems that only surface in a location-by-location comparison. Our inventory management guide goes deeper on how inventory data behaves across multiple sites, and it is worth reading alongside this one because inventory is where analytics investments most often pay for themselves first.
Clinically, the value is compliance variation. Preventive care compliance, dental recommendation and acceptance rates, and diagnostic recommendation rates vary widely between hospitals in the same group, often more widely than they vary between groups. That variation is a medical quality conversation before it is a revenue conversation, and it is the kind of finding that gives an analytics investment credibility with the doctors who otherwise experience it as surveillance.
The three categories of multi-location veterinary analytics software
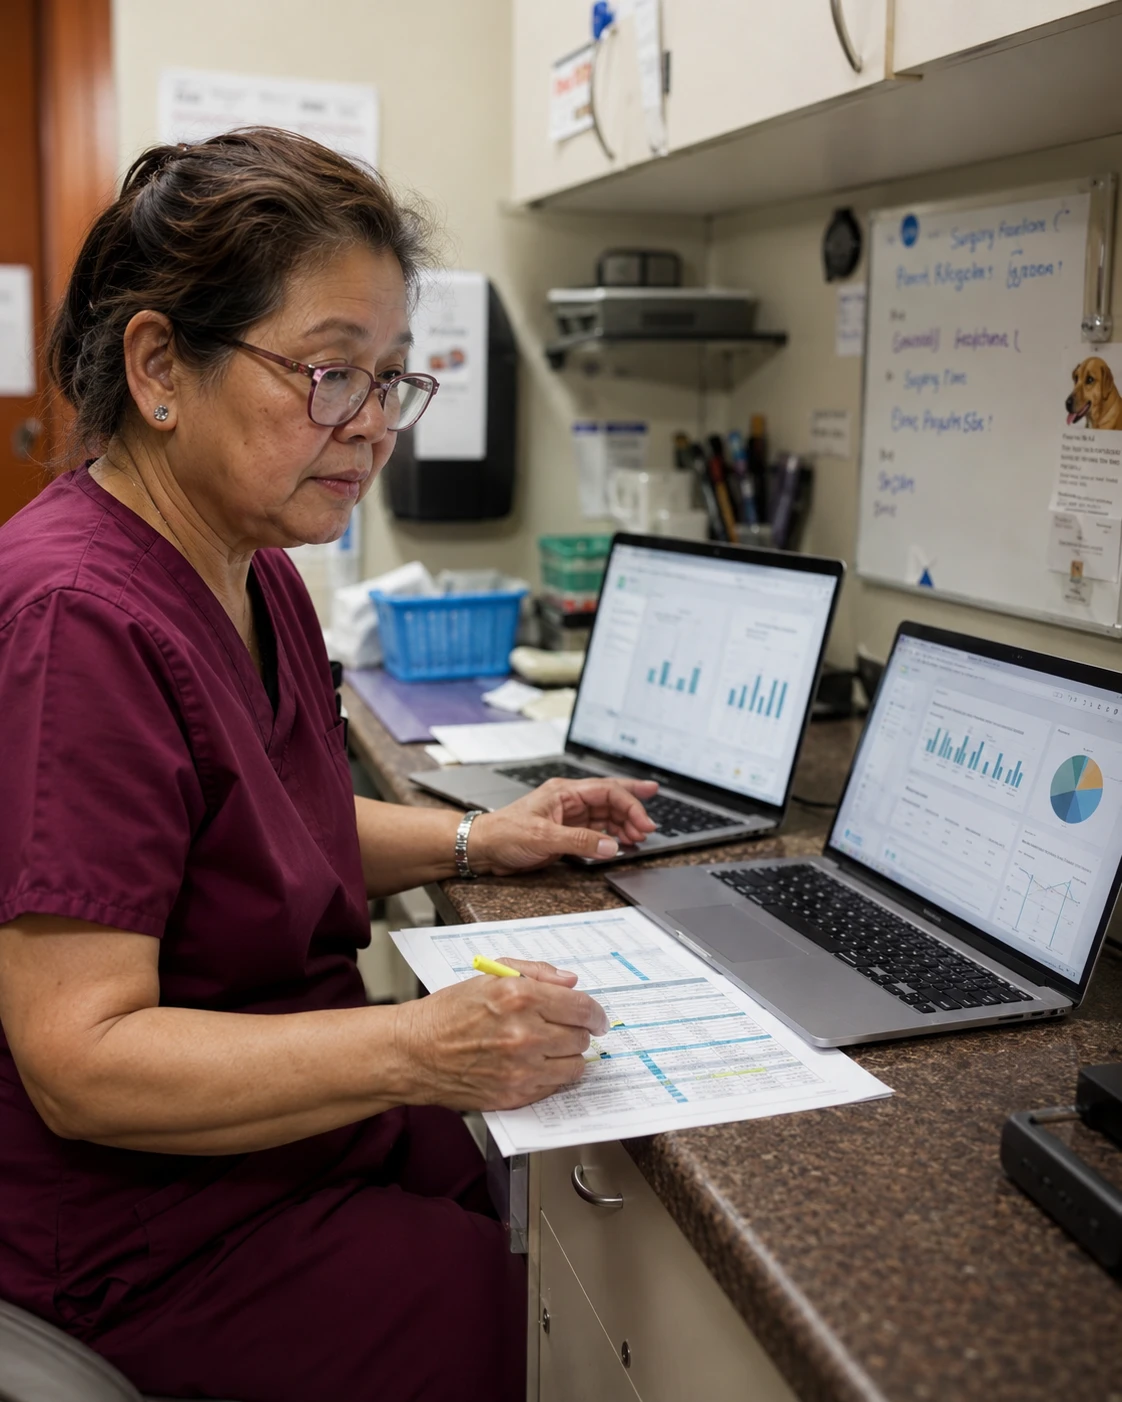
Almost everything in this market fits one of three buckets. The distinctions matter because the buckets have different costs, different implementation timelines, and different failure modes.
Category one: PIMS-native reporting and enterprise dashboards
This is reporting built into the practice management system you already run. At the low end it is the standard report library every PIMS ships with. At the high end it is a purpose-built enterprise layer.
ezyVet Enterprise is positioned squarely at corporate and multi-practice groups, with central management of multiple practice databases, secure data aggregation, and group-level visibility, plus the separate Data Lake product for organizations whose reporting needs exceed what standard reports and the API can serve. Provet Cloud, part of Nordhealth, markets its enterprise tier around centralized reporting across the organization, with data warehouse access and scheduled reporting reserved for higher tiers. Vetspire, which received a significant growth investment from Battery Ventures in August 2026 and serves more than 800 hospitals including multi-location groups such as Thrive Pet Healthcare, Petfolk, and Heart + Paw, offers an analytics module with multi-location filtering built in. Covetrus Pulse aggregates across locations for groups already inside that ecosystem.
The advantage of category one is obvious: no integration project, no separate vendor, no data movement, and definitions that at least match what the system itself uses. The limitation is equally obvious. It only sees the data in that system. If your six hospitals run three different PIMS, native reporting cannot solve your problem no matter how good it is, and it will not incorporate your general ledger, your payroll system, or your call center data. Native reporting is the right answer for groups standardized on a single platform with reasonably conventional reporting needs, and the wrong answer for anyone with a mixed estate or an appetite for combining clinical and financial data.
Category two: dedicated veterinary analytics and benchmarking platforms
These are third-party products built specifically for veterinary data. They connect to your PIMS, extract and normalize the data, and present dashboards designed around veterinary metrics rather than generic business ones.
Vetsource Data and Insights, formerly VetSuccess, is the most established name here and has operated in this space since 2011, offering practice performance dashboards, compliance tracking, and group-level solutions built on a normalization service and a managed Snowflake warehouse for groups that want analyst access to their own data. iVET360 approaches the same problem from a services angle, pairing analytics with bookkeeping and AAHA-standard chart of accounts work. Newer entrants including VetVision Analytics and Bittsi have appeared with ezyVet-connected and multi-PIMS dashboards at lower price points. On the benchmarking side, AAHA Benchmarking was built with Petabyte Technology to convert normalized live PIMS data into peer comparisons, and Veterinary Management Groups, historically Veterinary Study Groups and now majority owned by Covetrus, runs DATALINK, a long-standing benchmarking network built on a shared chart of accounts and reviewed by veterinary-specific CPAs.
A clarification is worth making here because it comes up constantly in search. DVMetrics is frequently assumed to be a veterinary business intelligence platform, and it is not. DVMetrics, which traces back to North American Compendiums and has served the profession since 1989, is primarily a clinical reference and compliance business: the Compendium of Veterinary Products, VetDocs medication information sheets, and the SDS Autobinder for OSHA safety data sheet management. Its data and market-trend work, including VetWatch, runs in partnership with Animalytix and others and is oriented toward the animal health industry rather than toward practice-side operational dashboards. If you are searching for DVMetrics expecting location-level KPI reporting, you are looking at the wrong shelf. That is not a criticism of the product, which does what it does well. It is a category correction.
The advantage of category two is that somebody else owns the normalization problem and the metric definitions come pre-built and veterinary-literate. The limitation is that you are working inside their model of the world. If your group defines production differently than the vendor does, you may or may not be able to change it, and blending in non-PIMS data sources ranges from possible to impossible depending on the product.
Category three: general-purpose BI on your own data
This is Tableau, Power BI, Looker, or a similar tool sitting on top of a warehouse you control, typically Snowflake, BigQuery, or Redshift, fed by extracts from each PIMS.
This is where larger consolidators end up, and increasingly where mid-sized groups are heading. The appeal is total control: your definitions, your data model, your ability to join clinical data to payroll, real estate costs, marketing spend, and acquisition pipeline in one place. Power BI in particular shows up frequently because groups already carry Microsoft licensing, which makes the incremental software cost look close to zero.
That last part is the trap. The software is the cheap component. What you are actually buying is an ongoing engineering commitment: pipelines that break when a PIMS changes a field, a mapping layer that needs maintenance as item codes proliferate, and at least one person whose job is to keep it running. Groups that go this route successfully treat it as hiring, not purchasing. Groups that fail treat it as a software decision and discover eighteen months later that the dashboards stopped refreshing in the spring and nobody noticed.
The emerging fourth layer: contributory data networks
Where the newer and narrower entrants fit
Two kinds of product sit outside the three categories and are worth knowing about while shopping. MeasureVet is category two in shape, unifying operational data across hospitals and reporting on staffing efficiency, scheduling effectiveness, revenue trends, and variability between locations, with an emphasis on role-specific direction rather than a general dashboard. It is also a young company founded in 2026 with a small team, which should change how you evaluate it rather than whether you do. Ask a young vendor the same questions, but press harder on references at your size and on whether you can export the normalized dataset.
Opvista is a different axis entirely: operational intelligence for physical assets rather than clinical or financial transactions, covering equipment records, preventive maintenance, service history, work orders, and vendor activity across locations. None of the three categories touches this, because none of it lives in the practice management system. An unplanned equipment failure on a Tuesday morning costs a hospital a day of surgery revenue that no average client transaction dashboard will ever explain. Groups building an analytics roadmap tend to assume every decision-relevant number originates in the PIMS, and downtime is the clearest evidence that it does not.
Both are listed in our multi-site practice intelligence category. The broader point is that the reporting gap in a multi-hospital group is rarely one gap, and the pieces do not all get closed by the same purchase.
Worth flagging separately, because it is not quite a purchase decision in the same way. A growing set of aggregators pool anonymized transactional data across thousands of practices and hand back benchmarks: how your revenue per visit compares to regional peers, how your parasiticide compliance stacks up, how visit volume is trending nationally. Vetsource, Animalytix, AAHA, and VMG all participate in some version of this. The value is context, which internal reporting cannot provide by definition. The trade is that your data becomes part of somebody else's dataset. That is a reasonable exchange for most groups, but it should be a decision you make consciously and with an understanding of what the contract permits.
The metrics and features that actually matter

Once you know which category you are shopping in, product differences narrow to a handful of things that genuinely separate good tools from demo-ware.
Normalization depth comes first and it is not close. Ask specifically how item codes are mapped, whether the mapping is automated or manual, who maintains it, what happens when a hospital adds fifty new codes next month, and whether you can see and edit the mapping table. A vendor that cannot show you the mapping layer is asking you to trust a black box with the numbers you will report to your bank.
Refresh cadence and data latency come second. Daily is common. Real time is rare and usually unnecessary. Weekly is fine for strategic metrics and useless for operational ones. What matters more than the headline number is what happens when a refresh fails, whether you are notified, and how long a backfill takes.
The organizational hierarchy model matters more than groups expect. You need to roll up by location, but also by region, by brand if you operate multiple, by service line if you have GP and emergency under one roof, and by doctor across locations for the increasing number of clinicians who float. If the tool only understands a flat list of hospitals, you will outgrow it the first time you reorganize.
Metric definitions and their editability are the fourth differentiator. The core veterinary KPI set is well established: average client transaction, revenue per visit, production per doctor FTE, new client count, client retention and reactivation rates, schedule utilization, inventory turns, and wellness plan penetration. The question is not whether a tool has them but whether its definitions match yours and whether you can change them if they do not. Wellness plan metrics deserve particular attention at multi-location scale because they behave like subscription metrics rather than transaction metrics, with monthly recurring revenue, churn, and lifetime value dynamics that most veterinary reporting handles poorly. Our wellness plan software guide covers those measurement issues in more depth.
Permissions and row-level security are fifth, and they are frequently an afterthought that becomes a crisis. A hospital director should see their own location in full and probably see peer locations anonymized or not at all. A regional director sees their region. A medical director sees clinical metrics across everything and financial metrics nowhere. If the tool cannot express that, you will end up either restricting access so tightly the data goes unused or opening it so widely that compensation conversations become uncomfortable.
Sixth, data portability and exit terms. Ask who owns the normalized dataset, whether you can export it in bulk, in what format, and what happens on termination. A group that spends two years building a mapping layer inside a vendor's platform and then cannot take it anywhere has bought a very expensive lock-in.
Finally, whether the tool does anything besides display. The gap between insight and action is where most analytics investments quietly die. A dashboard showing 340 overdue patients has produced no value until somebody contacts them. Some platforms trigger workflows, push alerts, or write back to the PIMS. Most do not. Knowing which you are buying prevents the disappointment of a beautiful dashboard nobody opens after the first month.
What multi-location veterinary analytics typically costs

Pricing in this category is almost entirely quote-based, which makes published figures scarce and comparisons difficult. The patterns are still reasonably consistent.
PIMS-native enterprise reporting is usually bundled into an enterprise tier rather than priced separately, which means the cost shows up as the delta between your current tier and the enterprise tier, frequently in the range of 15 to 40 percent above standard per-location pricing. Data lake or data warehouse access on top of that is often a separate line, sometimes a flat platform fee in the low thousands per month regardless of location count.
Dedicated veterinary analytics platforms cluster around per-location monthly pricing. The entry end of the market advertises figures near 99 dollars per month per site for dashboard-only products. Mid-market group offerings with normalization services included commonly land somewhere between 300 and 1,200 dollars per location per month depending on scope, with enterprise multi-location deployments running higher. Implementation and data mapping fees are frequently charged separately and range from a few thousand dollars to well into five figures for groups with messy legacy data.
General-purpose BI looks cheapest and rarely is. Power BI Pro licensing runs roughly 14 dollars per user per month, and a small Snowflake footprint might cost a few hundred dollars monthly. Then you add an analytics engineer at 120,000 to 180,000 dollars fully loaded, or an outside data consultancy at 150 to 250 dollars an hour for the build and a retainer for maintenance. A ten-hospital group should assume a first-year all-in cost between 80,000 and 200,000 dollars for a real warehouse build, and should not assume year two drops to zero.
The return math is more approachable than the pricing. If a group of six hospitals averaging 2.2 million dollars in revenue each finds a two percent improvement through price integrity, missed charge recovery, and inventory correction, that is roughly 264,000 dollars annually. Against a 60,000 dollar analytics spend, the payback period is measured in months. The catch, and it is a real one, is that the improvement only materializes if somebody acts on the findings. Groups that buy analytics without assigning ownership of the follow-up get the cost and not the return. When you are modeling this across a multi-year horizon, our five-year TCO calculator is a useful frame for including the implementation and internal labor costs that quotes tend to omit.
Implementation considerations for multi-location veterinary analytics

Four things determine whether this goes well.
Data cleanup comes before the tool, not after. The most common sequencing error is buying a platform and expecting implementation to fix the item file. It will not. Somebody at each hospital needs to reconcile duplicate codes, retire dead ones, and agree on categories, and that work is measured in weeks per location. Groups that do a cleanup pass first cut implementation timelines roughly in half. This is the same discipline that makes a system migration succeed, and the approach in our guide to documenting workflows before replacing software transfers directly.
Write the definitions down before the build. Produce a one-page metric dictionary that states exactly how your group defines active client, FTE, average client transaction, visit, and new client. Get the medical director and the CFO to sign it. Every argument you have about definitions after go-live will cost ten times more than having it now, because by then the numbers are in front of a lender.
Plan for the acquisition case explicitly. If you are acquiring, you will regularly have a hospital running an unfamiliar system for six to eighteen months. Ask every vendor how a newly acquired location gets onboarded, how long it takes, what it costs, and whether historical data from before the acquisition can be loaded. Groups that skip this question end up with a portfolio dashboard that structurally excludes their newest hospitals, which are usually the ones needing the most attention.
Decide who owns it before you sign. Analytics platforms fail from neglect far more often than from technical inadequacy. Name the person responsible for the mapping layer, the monthly review, and the follow-up actions. If that person does not exist yet, the honest answer is that you are not ready to buy, or that hiring them is part of the purchase.
Finally, expect a realistic timeline. A single-PIMS group on a native enterprise tier can be live in four to eight weeks. A mixed-estate group deploying a third-party platform should plan on three to five months. A custom warehouse build is a six to twelve month project before anyone gets a trustworthy dashboard.
Ten questions to ask vendors during a demo

-
Show me exactly how you map item codes across locations, using messy sample data rather than your clean demo dataset. Who maintains that mapping over time, and can I see and edit it myself?
-
Which practice management systems do you connect to today in production, at what refresh frequency, and can you name a group of my size running my specific combination of systems?
-
What does my PIMS vendor charge for the data access your product requires, and is that fee per location, one time, or recurring?
-
How exactly do you define average client transaction, production per FTE, active client, and client retention? Can I change those definitions, and if so, does it recalculate history?
-
Show me the permissions model. How do I give a hospital director their own numbers, a regional director their region, and a medical director clinical metrics without financials?
-
What happens when a data refresh fails? Who is notified, how quickly, and how do you backfill?
-
When we acquire a hospital on a system we do not currently run, what is the onboarding process, the timeline, the cost, and can we load its pre-acquisition history?
-
Can I export the full normalized dataset in bulk, in what format, and what happens to it if we terminate?
-
Is my practice data contributed to any aggregated or benchmarking dataset, and what exactly does that contract permit you to do with it?
-
Beyond displaying numbers, what does your product do? Does it alert, trigger workflows, or write back to the PIMS, and can you demonstrate that live?
Common mistakes groups make
The first is buying dashboards before agreeing on definitions. This produces a tool that renders your existing disagreements in high resolution and adds a subscription fee. Definitions are a management exercise, not a software feature, and no vendor can do it for you.
The second is underestimating the maintenance burden of the do-it-yourself path. The general-purpose BI route is genuinely the right answer for many groups above roughly fifteen locations, but only when it comes with a named owner and a budget line for that owner. Building it as a side project of a technically inclined practice manager works until that person takes a vacation or a different job.
The third is measuring everything. Groups routinely launch with forty metrics on a dashboard nobody reads. The operators who get value from this typically watch three to five numbers per role and review them on a fixed cadence with a named owner for each. Everything else lives one click deeper, available when a question arises rather than competing for attention daily.
The fourth is treating benchmarks as targets. External benchmarks tell you where you sit relative to a peer set whose composition you cannot see and whose mix may not resemble yours. A rural two-doctor practice and an urban emergency hospital do not share an operating model, and forcing one toward the other's numbers produces bad decisions. Benchmarks are useful for raising questions and dangerous as goals.
The fifth is ignoring the migration angle. If you are also evaluating a system change, the reporting requirement should be part of that evaluation rather than a separate project six months later. Groups frequently select a PIMS on clinical workflow, discover the reporting cannot serve the portfolio, and then buy a second product to compensate. Our 2026 PIMS buyer's guide and the broader practice management category are the right starting points if both decisions are live at once.
A simple framework for narrowing the shortlist
Three questions will get most groups to a category, and category is most of the decision.
First, are all of your locations on one practice management system, and do you expect that to remain true for the next three years? If yes, start with your existing vendor's enterprise reporting tier. It is the cheapest path, requires no integration, and will be adequate for a meaningful share of groups. Only shop outside it once you have confirmed a specific requirement it cannot meet.
Second, if the answer is no, do you need to combine PIMS data with anything else, such as general ledger, payroll, marketing spend, or call center data? If you only need PIMS data normalized across mixed systems, a dedicated veterinary analytics platform is almost certainly the efficient answer. The normalization work is the hard part and buying it is cheaper than building it.
Third, if you do need to blend PIMS data with other sources, and you have or will hire someone to own data engineering, then the warehouse plus general-purpose BI path becomes appropriate. If you need the blend but will not hire the person, buy the veterinary platform anyway and accept the limitations. A working narrow tool beats an ambitious broken one every time.
Then check references from groups of your size with your system combination. The vendor's flagship reference is usually a forty-hospital platform with a data team, which tells you almost nothing about how the product behaves for a six-hospital group without one. Our guide to checking references properly covers how to get past the curated call.
Closing thought
The groups that get real value from multi-location veterinary analytics are rarely the ones with the most sophisticated tooling. They are the ones who decided what they wanted to measure, wrote it down, cleaned the underlying data, assigned somebody to own it, and then bought the simplest product that could deliver it. The technology in this category has improved considerably, and normalization that used to require a dedicated analyst is increasingly available as a service. What has not changed is that a dashboard is an instrument panel, not a pilot. It tells you the altitude is dropping. Somebody still has to pull up.
If your group is weighing a system change alongside its reporting problem, the two decisions are more entangled than they look, and getting the order wrong is costly. The PIMS Selection Navigator is a fixed-fee, vendor-neutral engagement built to work through exactly that kind of evaluation with practices rather than for vendors. You can learn more at VetSoftwareHub.


